|
|
SEQMOL is a PDB structure analysis suite.
SEQMOL can
be used to align multiple protein and DNA
sequences, compute evolutionary
attributes of multiple sequence alignments
(such as sequence conservation,
hydrophobicity conservation, conformational
flexibility conservation,
physical covariation, protein-protein interface,
protein-RNA interface and
protein-DNA interface propensity, and conservations
thereof) and to map these
features onto PDB files.
Many of the features do not use multiple sequence
alignment and directly analyze
PDB coordinates to yield insights that could
often be valuable.
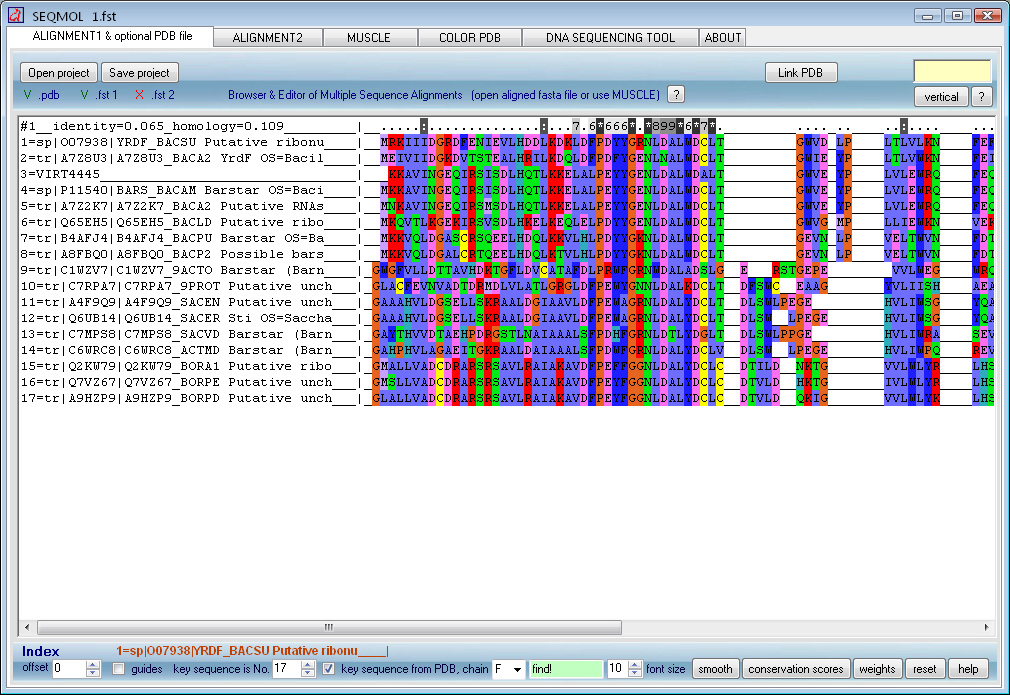
Some of the SEQMOL components:
- Maker and editor of multiple sequence alignments
- PDB surface solvation (by water) and Coulomb
electrostatics analysis module
-
Protein/Protein and rather accurate protein/RNA binding sites predictions module
- Binding constants prediction
module for PDB complexes and crystal contacts
based on a de-novo built
algorithm with sound Kd accuracy
* Kd predictions in SEQMOL are
user-friendly and usually fast (seconds-minutes for
average-sized complexes
on a local CPU). A PDB file is DragDropped onto the
application. Kd along with a comprehensive interface analysis is produced in
the output.
For multiple-PDB jobs, such as scoring of decoys from docking
programs,
batch PDB processing is done automatically if more than one PDB
was DragDropped.
** Perhaps this is where SEQMOL use is particularly appealing. If
we could know Kd
for each interface in a protein crystal, we would be able
to tell which crystallization
interfaces are real and biologically important
and which are not.
Unfortunately, measuring individual Kd of crystal
interfaces is not possible.
At
present it is accepted to sometimes look at burial of accessible surface area
(ASA burial), at solvation, and sometimes at electrostatic complementarity
of interfaces
to tell non-specific crystal packing contacts from true
interfaces.
Yet, many stable
complexes have mismatched electrostatics; some don't bury
very much ASA and
some have unfavorable desolvation energy. And vice versa,
some weak crystal
contacts are extensive and appear stable.
This problem is minimized by SEQMOL. It
usually can identify stable or weak complexes
by calculating Kd for formation
of interfaces. Except for proteins undergoing major
conformational changes,
calculated Kds often agree with those
from experimental measurements.
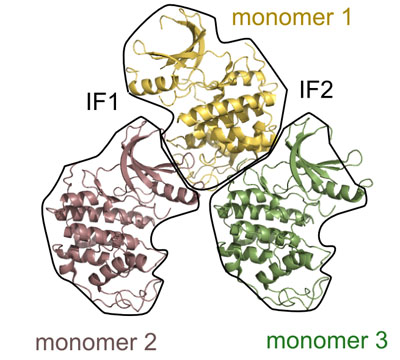
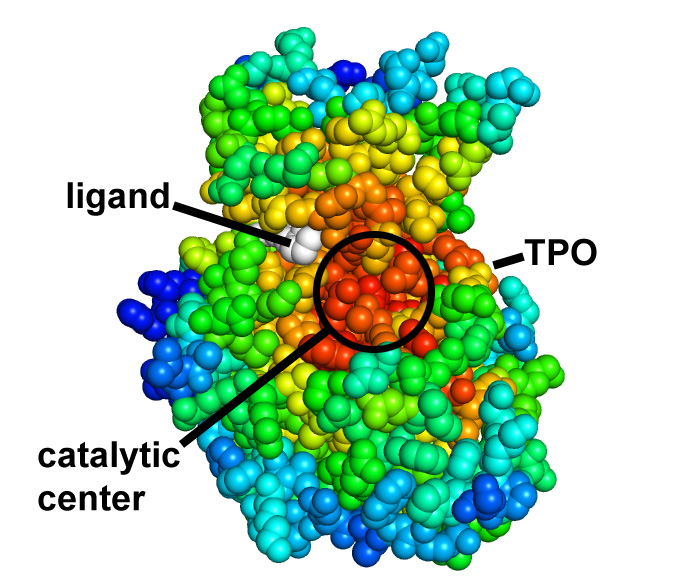
Picture above is crystal packing of one of CDK2 kinase complexes.
Two rather large kinase-kinase
interfaces can be seen in the structure.
Not much can be added to this picture, but after SEQMOL is
used
additional and very non-intuitive information
is obtained:
IF1
dEsolv +8264.6
kcal/mol
dEelec -62.32
kcal/mol
dEnthalpy 13
A.U.
dASA -1684.6 (A^2)
dEntropy 119 A.U.
dGbinding -7.86 kcal/mol
Kd 1.84E-06M
IF2
dEsolv -2927.2 kcal/mol
dEelec 113.85 kcal/mol
dEnthalpy 6 A.U.
dASA
-1417.6 (A^2)
dEntropy 84 A.U.
dGbinding -6.63 kcal/mol
Kd 1.45E-05M
Both interfaces are
somewhat unstable (Kd ~ 1-10 uM); IF1 is more stable.
IF1 has a very
unfavorable solvation energy and IF2 has a very
favorable solvation energy
(yet weaker Kd!).
Electrostatics
opposes the formation of the IF2
and helps the formation of the IF1. This
information is useful
for designing mutations for testing the
interfaces.
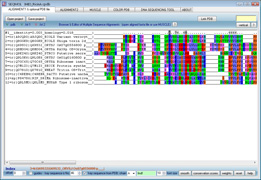
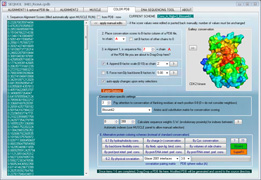
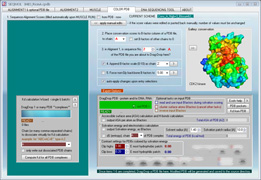
screen shots (click to enlarge)
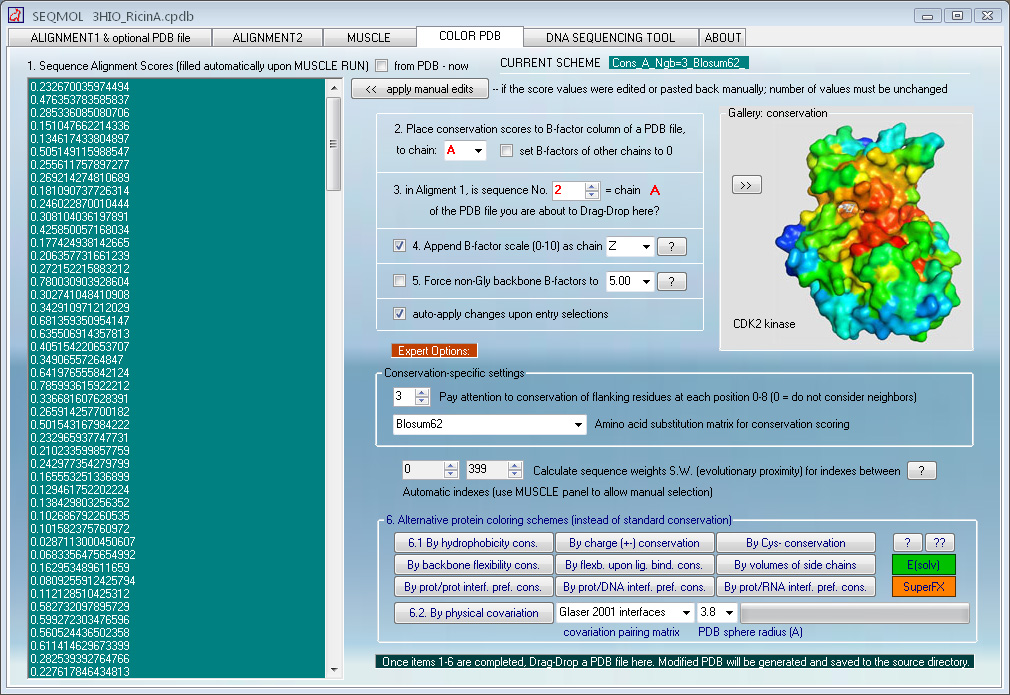
Protein coloring by sequence alignment attributes example
CDK2 kinase colored by conservation, physical
covariation, hydrophobicity conservation and charge conservation based on 222
non-redundant sequences of CDK2 tion based on 222 non-redundant sequences of
CDK2 (click images for close view)
Download
PDB files for the above
images
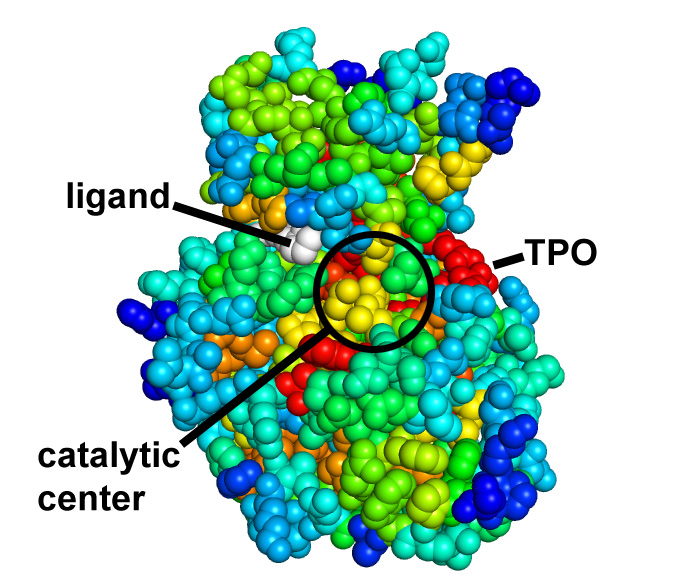
Predicting protein-protein interactions by two different
ways
SH3 domain of Abl kinase (PDB ID 1abo). This domain binds
a proline-rich peptide
APTMPPPLPP.
Approach 1
Approach 2
|
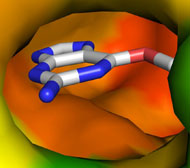
Conservation of protein-protein interaction propensity
low
high
peptide shown
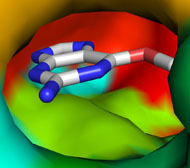
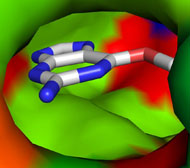
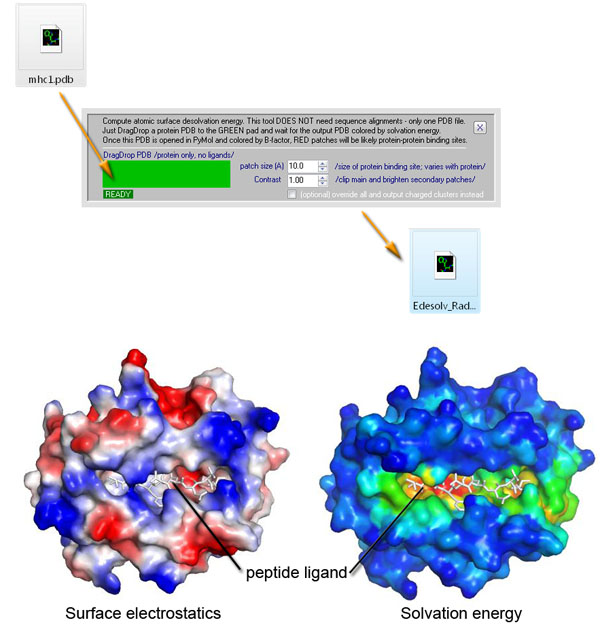
Surface solvation energy (based on ODA method)
low
high
peptide shown
|
Approach 2 summary: Binding
sites on proteins sometimes employ electrostatic forces. Protein surface
electrostatics can be calculated usign Poisson-Boltzmann solvers such as APBS.
Often, however, hydrophobic interactions provide the binding energy and
electrostatics is not involved. As of version 3.2.7, SEQMOL can evaluate this
type of surface properties and calculate solvation energy of protein surfaces
using a local variant of ODA approach by L. Perez-Cano et al. The process is
reasonably fast and takes seconds-minutes for most proteins; the scores are
mapped on the protein surace as B-factors (PyMOL->Color by B-factors). An
exmaple of solvation energy calculation for MHCI:
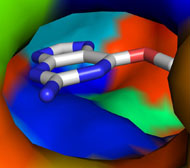
Per-atom surface solvation patch energy of dipeptidyl
peptidase IV computed separately for
chains A and B (PDB 3KWH). Surface region that forms
protein-protein interface stands out
as having very high desolvation energy and is seen as the
red patch. Crystal structure of
the monomer thus correctly shows the location of a strong
protein binding site.
chain
A chain B
Surface colored by per-atom solvation energy. Note the red "hot spot".
chain A
For comparison: this surface is colored by conventional "hydrophobicity" of residues (W, F, Y, A, L, V, I etc are more blue, D, E, N, Q, R, K, S, T etc are more red). The "hot spot" is not obvious.
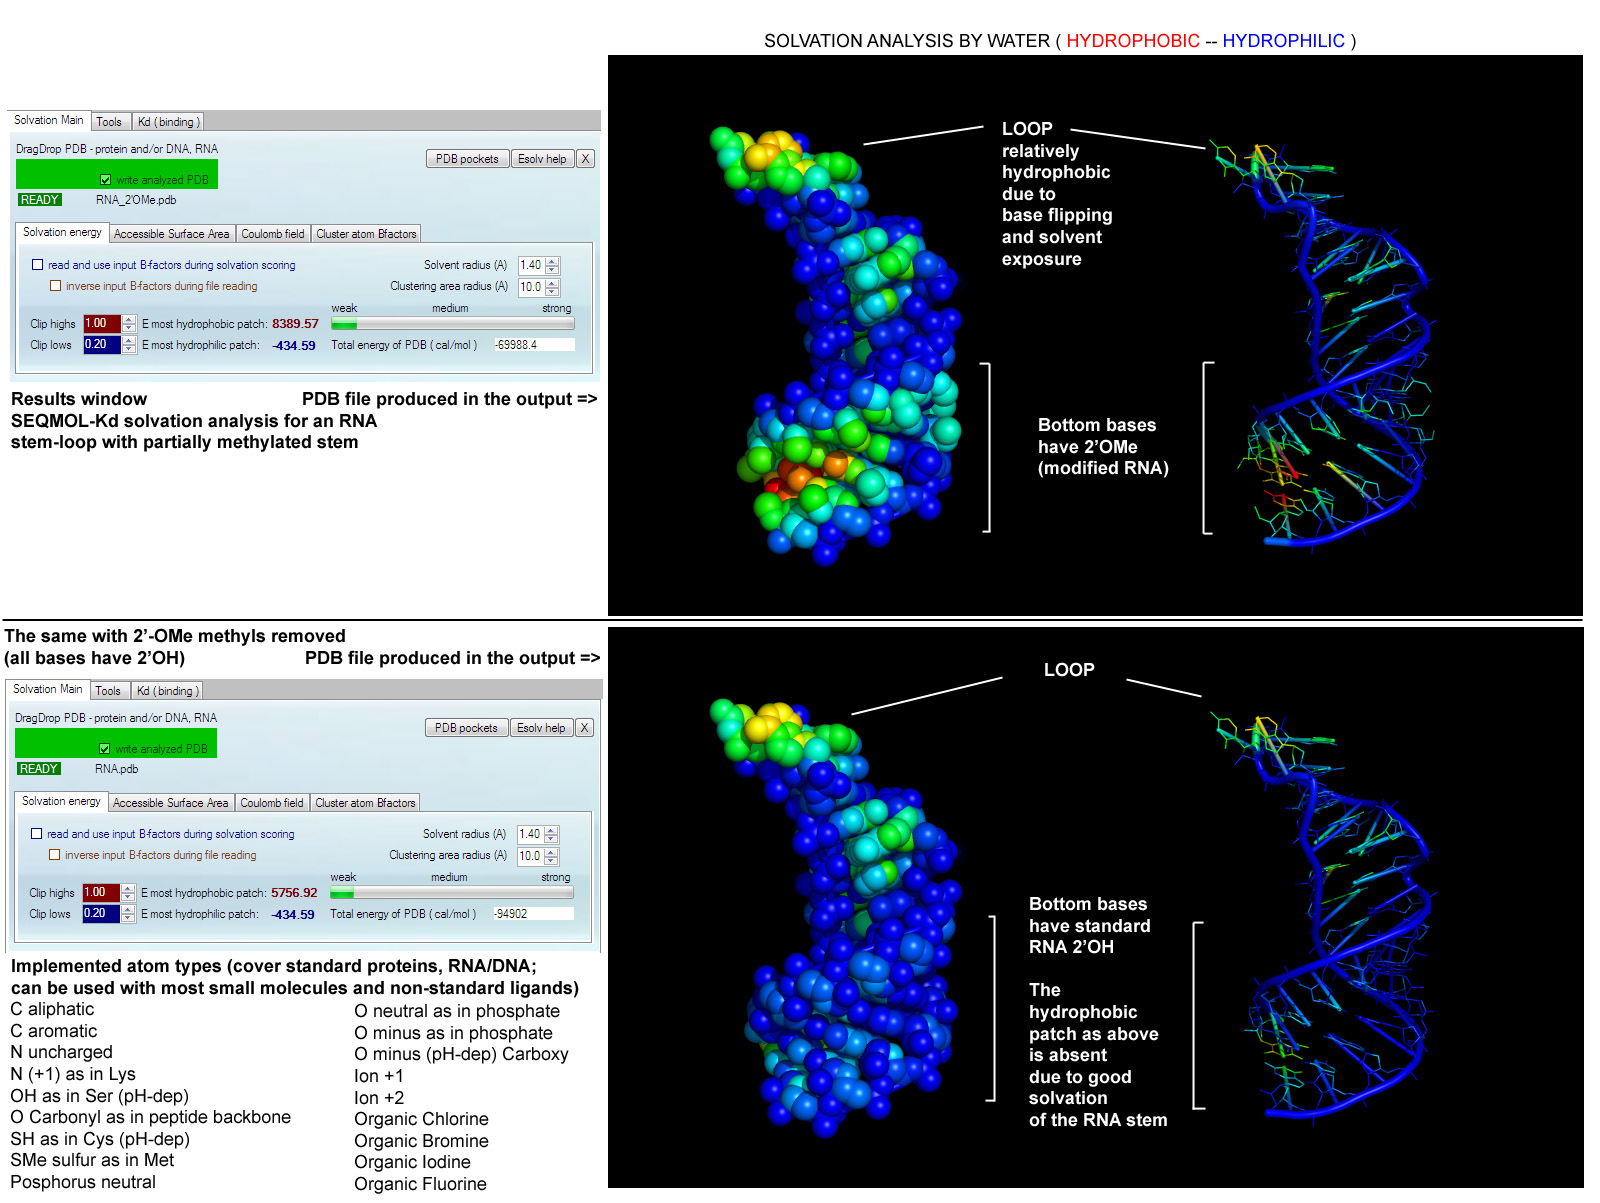
Nucleic acid desolvation analysis example.
Predicting protein-RNA binding sites via residue interface
propensity conservation
with subsequent patch energy calculation
Surface electrostatics (blue-red) vs RNA binding patch
energy (SRP PDB ID 1QZW).
Note that patch energy shows only correct RNA binding site
(red patch) whereas
surface electrostatics commonly used to evaluate RNA
binding sites is ambigous.
PDB structure analyses -- without
sequence alignments
PDB-based calculation of surface burial, electrostatic
energy and solvation energy for proteins and nucleic acids and protein-protein
protein-RNA and protein-DNA complexes. The program's output is both,
quantitative (a single whole-PDB value) and qualitative (PDB surface is colored
by scaled per-atom values).
One unplanned but useful appliation of this module is to
find pockets in PDB structures by clustering solvent-exposed atoms (read
built-in help for explanations).
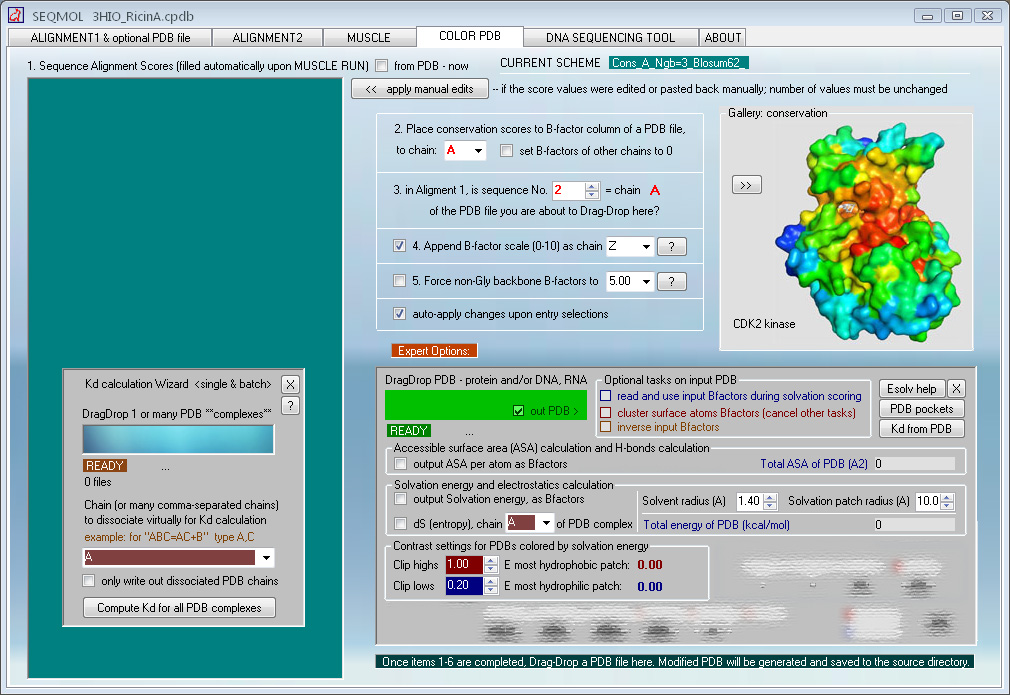
Computing binding constants from PDB coordinates
A dedicated module in SEQMOL can calculate binding
free energy (at 1-molar reference state and 25 oC) and binding constants for
protein-protein and *possibly* protein-(RNA/DNA) complexes (this method was
developed explicitly for protein-protein interactions but seems to give relevant
numbers for some protein-RNA complexes).
The goal of SEQMOL is to not just predict trends in
binding energy, but to predict as closely as possible
real Kd values one would measure in a lab.
The procedure is fully automated and only calls for
DragDropping a PDB and selecting chain/chains for virtual dissociation and Kd
measurement.
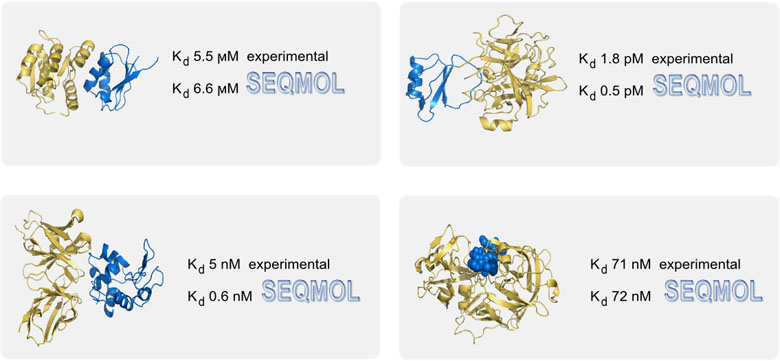
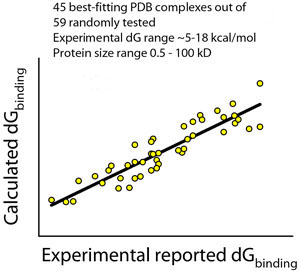
Accuracy** disclaimer: in some cases binding constants may
be off from the real values by orders of magnitude. However, more frequently
than not, they are correct. For example, for 45 out of 59 examined complexes
(76%) from the PDB database, computed binding constants were within 2.5 kcal/mol
from the experimental values throughout the Kd range from subpicomoles to
millimoles, and protein size range from short peptides to large proteins over 50
kD. Deviations in SEQMOL Kd may arise from several reasons: from assumptions in
the code, from the fact that binding constants depend on the reaction
temperature and buffers (pH, salt concentration), which differ between published
Kd, whereas SEQMOL always reports a value projected for an "average" ideal
buffer and standard conditions. Many PDB structures are solved at resolutions
that do not allow to unmabiguously place some rotamers (HIS, ASN, GLN),
resulting in PDB coordinate errors which also contribute to the calculation vs
experiment scatter.
**accuracy improved
further in recent builds of SEQMOL
Build 3.4.0 dG accuracy test table:
95% predictions are under 2
kcal/mol from experiment
|
PDB ID |
dASA (A^2) |
dGexpmt |
dGcalc |
ddG |
|
1e.. |
-766.7 |
-4.39 |
-4.36 |
+0.029 |
|
1d.. |
-1159.3 |
-6.80 |
-6.48 |
+0.315 |
|
1m.. |
-1240.2 |
-7.30 |
-6.70 |
+0.603 |
|
1a.. |
-1160.8 |
-8.00 |
-6.22 |
+1.781 |
|
1b.. |
-879.0 |
-8.10 |
-8.63 |
-0.527 |
|
1j.. |
-1237.5 |
-8.13 |
-9.53 |
-1.397 |
|
1b.. |
-1795.7 |
-8.90 |
-8.71 |
+0.187 |
|
3g.. |
-2359.0 |
-9.20 |
-8.83 |
+0.369 |
|
2b.. |
-1366.4 |
-9.59 |
-10.70 |
-1.113 |
|
2p.. |
-1198.4 |
-9.70 |
-10.59 |
-0.890 |
|
1b.. |
-1338.4 |
-9.70 |
-10.17 |
-0.463 |
|
1p.. |
-1453.8 |
-9.76 |
-8.82 |
+0.945 |
|
1g.. |
-1160.2 |
-9.79 |
-9.28 |
+0.509 |
|
1w.. |
-1205.7 |
-9.80 |
-9.16 |
+0.636 |
|
2e.. |
-1503.9 |
-9.80 |
-10.81 |
-1.012 |
|
1b.. |
-931.3 |
-10.10 |
-8.65 |
+1.447 |
|
1g.. |
-1314.5 |
-10.10 |
-9.72 |
+0.378 |
|
1p.. |
-1615.6 |
-10.22 |
-10.26 |
-0.040 |
|
1y.. |
-1533.4 |
-10.30 |
-9.15 |
+1.143 |
|
2n.. |
-1279.1 |
-10.30 |
-11.51 |
-1.210 |
|
1k.. |
-2408.3 |
-10.50 |
-10.47 |
+0.026 |
|
2b.. |
-1723.7 |
-10.95 |
-12.71 |
-1.768 |
|
1y.. |
-2906.1 |
-11.03 |
-9.29 |
+1.730 |
|
1s.. |
-1305.8 |
-11.40 |
-9.60 |
+1.795 |
|
1a.. |
-1960.7 |
-11.50 |
-11.54 |
-0.041 |
|
1f.. |
-1270.1 |
-11.60 |
-12.26 |
-0.675 |
|
2j.. |
-1540.4 |
-11.70 |
-13.09 |
-1.392 |
|
1m.. |
-1046.0 |
-11.70 |
-12.66 |
-0.968 |
|
1v.. |
-1430.1 |
-11.80 |
-14.13 |
-2.326 |
|
1a.. |
-1793.5 |
-11.90 |
-12.80 |
-0.901 |
|
1j.. |
-1931.3 |
-12.30 |
-11.34 |
+0.962 |
|
1f.. |
-2011.0 |
-13.00 |
-12.78 |
+0.219 |
|
1c.. |
-1510.3 |
-13.46 |
-14.16 |
-0.702 |
|
2s.. |
-1508.4 |
-13.50 |
-14.69 |
-1.188 |
|
1j.. |
-1295.3 |
-13.90 |
-11.81 |
+2.087 |
|
2s.. |
-1628.7 |
-13.90 |
-14.26 |
-0.364 |
|
1j.. |
-2251.1 |
-14.50 |
-12.87 |
+1.627 |
|
3h.. |
-1647.5 |
-15.00 |
-16.14 |
-1.141 |
|
1h.. |
-1690.5 |
-15.50 |
-14.89 |
+0.608 |
|
2s.. |
-1651.7 |
-16.00 |
-15.18 |
+0.820 |
|
1a.. |
-1587.9 |
-17.00 |
-16.44 |
+0.562 |
|
1b.. |
-1577.8 |
-17.30 |
-17.64 |
-0.344 |
|
1a.. |
-2753.9 |
-20.70 |
-21.02 |
-0.318 |
these PDB structures are
mostly unrelated and cover a large functional
space e.g. diverse enzymes, antibodies, receptors, peptide
binding motifs
and a vast range of interface sizes
A reading about performance of 9 alternative Kd prediction algorithms:
"Are scoring functions in protein-protein docking ready to predict interactomes?
Clues from a novel binding affinity benchmark."
Kastritis PL, Bonvin AM. J Proteome Res.
2010 May 7; 9(5) 2216-25
PMID: 20329755
Beyond predicting Kd
Proteins crystallize forming several protein-protein
interfaces in the crystal. Distinguishing true interfaces and
crystallographic
interfaces presents a challenge. With SEQMOL, it is
possible to compute Kd for all observed protein-protein contacts in the crystal
and obtain a good measure of the interface stability along with realistic Kds
for their formation.
This method is greatly superior to guesses based on
surface conservation or accesible surface area (ASA burial), see the table
above.
Finding hot spots at
protein/protein interfaces
SEQMOL-Kd hosts a utility for one-click generation of PDBs with ALA-scans of any interfaces of choice.
"Hot spot" residues
can be identified by a large effect on the binding free energy of the resulting ALA-permuted PDBs.
Protein-protein docking: SEQMOL as a decoy filtering
utility
Another appliction of the Kd prediction module is to
filter results of protein-protein docking programs.
In the test example below, two monomers of a known protein
complex were randomly oriented in 3D space. Then they were docked back using
Hex 6.0 docking utility. The docking run produced 500 solutions,
top 20 of which had energy range from -560 to -470 "Hex units".
During the next step, Kd for the 20 top solutions were
calulated with SEQMOL. The range of Kd was from 49000 moles (!) to 1.0
micromole. 15 of the 20 solutions had Kd around 1 mM or weaker, and are likely
to be irrelevant. The best complex according to the Hex energy was ranked #9
with Kd 1.47M (very unstable). The most stable complex according to SEQMOL (Kd 1
micromole) was similar to the one actually seen in the crystal structure:
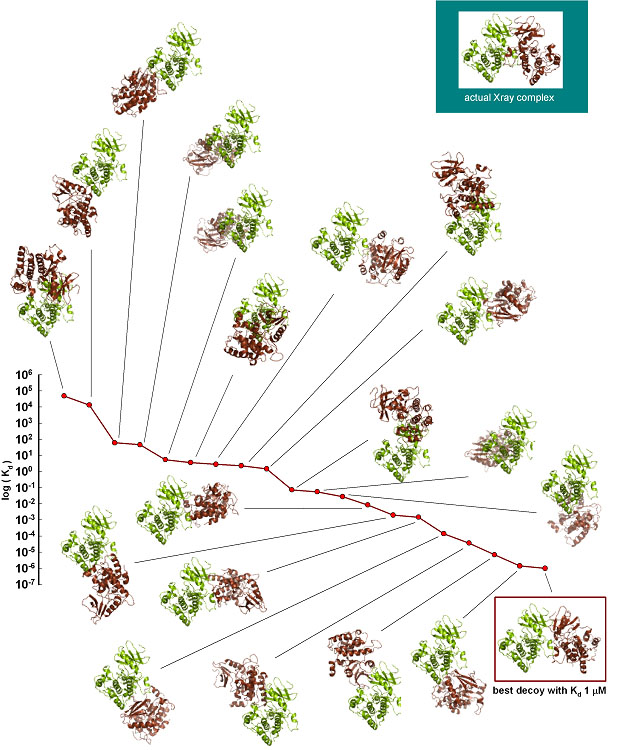
Docking two proteins: by predicting binding constants for
20 top-ranking docking solutions
(with similar docking scores)
it was possible to identify very unstable and very stable
solutions.
In this example the most stable complex, as ranked by SEQMOL,
was also the near-native one.
How to cite SEQMOL in a publication
SEQMOL ("sequences & molecules")
can be used
"as is" with limited functionality or licensed using
built-in licensing module.
If you used the program for your paper, please cite it as
we used SEQMOL or
SEQMOL (biochemlabsolutions.com) was used.
Many of the methods used in SEQMOL have been published by different and
truly great authors.
Relevant references
are given either on this website or in help boxes within the program. Some
methods are new and
have not been published in peer-reviewed journals yet. They will be one day.
At
present it is important
that they all work and help with generating testable hypotheses and
often do well at extractintg information from
protein sequences and PDB structures.
|
|
DOWNLOAD Version 3.4.7
Many features will work as is, some will require
licensing.
Kd module, RNA binding sites module and Solvation module work on subscription basis.
Recent changes
- Kd calculation module (RELEASED)
- PDB structure analysis: calculate surface
burial, electrostatic energiy, solvation
energy of proteins and nucleic acids
and of protein-protein protein-RNA and
protein-DNA complexes
- Calculation of solvent-accessible area (ASA)
of all atoms in PDB
(protein, RNA, DNA)
- Incorporation of ODA and OPRA algorithms for
predicting
protein-RNA and protein-protein
interfaces
(based on papers by Laura Perez-Cano
and Juan Fernandez-Recio)
- Calculation of protein-protein, protein-RNA
and protein-DNA binding sites
based on evolutionary conservation
of residue propensities
- Improved surface hydrophobicity calculation
routine. SEQMOL no longer
uses conventional hydrophobicity
scales
- Computation of conformational flexibility of
regions in PDB files using
multiple sequence alignments. Color
PDB files by conservation of
conformational flexibility to predict
rigid and dynamic parts.
- Ability to color
backbone atoms separately from main chain atoms
using "5.1 Force backbone B-factors
to" option.
When used, for example, during
coloring by charge conservation,
the actual conservation of charges on
the surface stands out better
if all backbone atoms have a neutral
B-factor of 5.00.
- More convenient DNA sequencing tool.
Some uses of the program
o Multiple sequence alignment of proteins, DNA and RNA
Several variants of the open source
MUSCLE program are integrated
into this distributive - courtesy of
Robert C. Edgar
o Browsing and
editing
of
multiple sequence alignments, saving results
in several formats, including print-ready rtf (examples:
rtf pdf)
o Calculating sequence alignment features such as
conservation,
hydrophobicity conservation and other types of scoring schemes;
mapping these features onto PDB structures of proteins,
RNA and DNA
o Integration of sequence alignments with
PDB files to
link residues in PDB structures with sequence alignments
o Exploring interresidue interactions in PDB
structures to evaluate different
conformations, structures and interfaces based on physical
covariation
analysis. Briefly, the algorithm detects 3D partners of each
residue in a PDB file, then scores physical complementarity of
resulting
residue-residue pairs, then evaluates how well this complementarity
is
conserved between aligned sequences and outputs the resulting
score for each residue, with the possibility to color residues in
the PDB file according to this score.
o
Accessible surface area, solvation energy, surface electrostatics
calculations for PDB
o Protein/protein and protein/RNA binding sites predictions
o Binding energy and Kd predictions for protein/protein
and - tentatively - for protein/RNA complexes
o Analysis of DNA sequencing results
Manual
|