SEQMOL index
Coloring PDB files by sequence alignment features
To color PDB file by sequence alignment attributes, sequence alignment and a linked PDB file must be provided (these entire linked projects can be saved as *.cpdb).
Color a PDB by conservation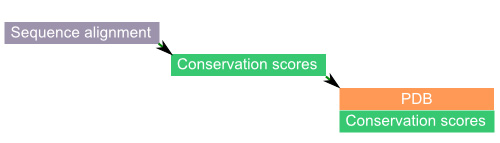
The algorithm built into this program goes beyond simple Shannon entropy scoring and physical similarity scoring. It does not simply consider that "K is like R" and "E is like D", but carries out a rather involving weighting and scoring of the residues, uses amino acid substitution matrices and considers sequence context of each residue to assign scores. Evolutionary tree is not used in the analysis in favor of Heinkoff weights.
1. Open sequence alignment and PDB files, or saved previously *.cpdb poject: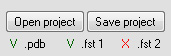
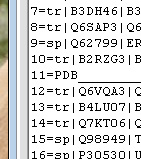
2. Set up the PDB-alignment link.
In this example, sequence No. 11 in the alignment is the same as that of chain A from the provided PDB coordinates:
![]()
3. In "Color PDB" tab, make appropriate changes.
select chain:![]()
select sequence No.
Conservation scores will be calculated: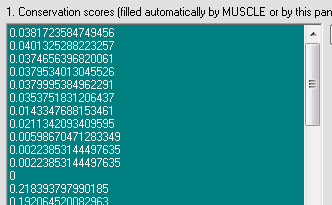
At this point, drag-dropping a PDB file (having correct format) onto the "Color PDB" panel should instantly produce conservation-colored PDB (open generated PDB file in a PDB viewer and color structure by B-factor).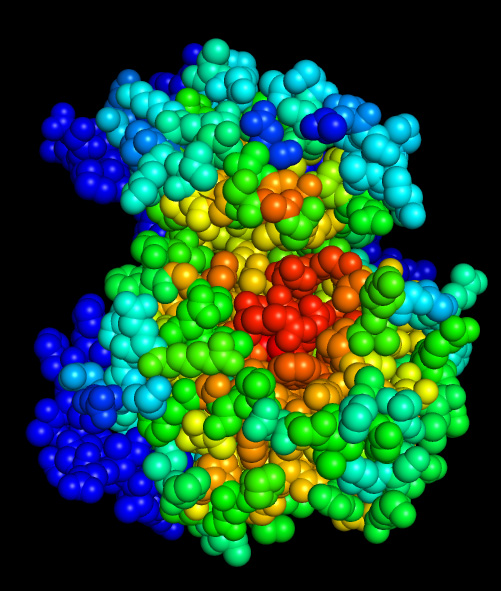
Catalytic residues and ATP-binding pocket of this kinase stand out as conserved (red).
The following 8 conservation scoring matrices are implemented and can be used to compute conservation scores and color PDB coordinates: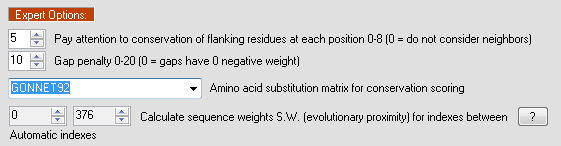
Blosum62
Rogov-Nekrasov
GONNET92
PAM120
PAM250
PET91
DNA
RNA
Color PDB by physical co-variation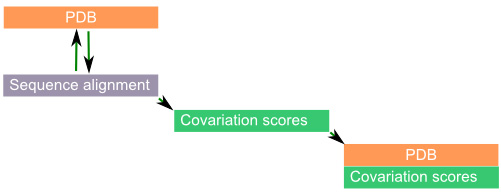
This coloring scheme evaluates 3D partners of all PDB residues for their physical complementarity to their structural partners during evolution.
The results of this algorithm are very different from sequence conservation scoring. For example, conserved residues may receive a low covariation score, if they do not have good partnering amino acids in the PDB file. This could signify that this is an important protein-protein interface residue whose score will improve when a partnering protein is added to the PDB structure (this can be done within the program). It could also be an active site or a ligand-binding residue.
Some poorly conserved residues could receive high covariation score because they have high complementarity to their partners, which mutate along. These residues too may have functional roles.
PDB colored by physical covariation: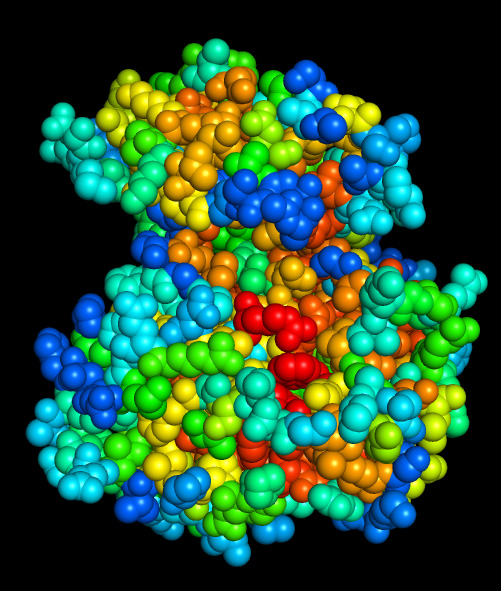
Unlike all other coloring scales implemented here, this scale depends on PDB structure and will give different scores for PDB files having different conformations or when interacting proteins are present and included in the analysis. Read built-in help (? and ?? buttons) for specifics of these cases and for co-variation analysis of protein-protein interfaces.
Four different pairing matrices are implemented for calculating co-variation scores,
Glaser 2001 interfaces
Headd 2007 interfaces
Intrachain Headd 2007
Average of Headd 2007
Coloring by conservation of hydrophobicity and charge is very straightforward: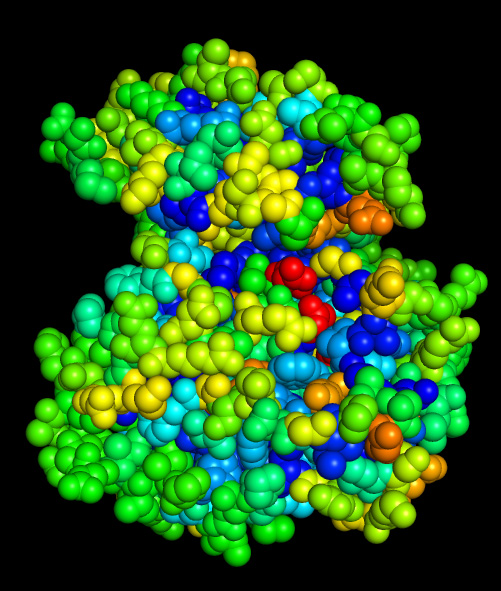
Hydrophobicity conservation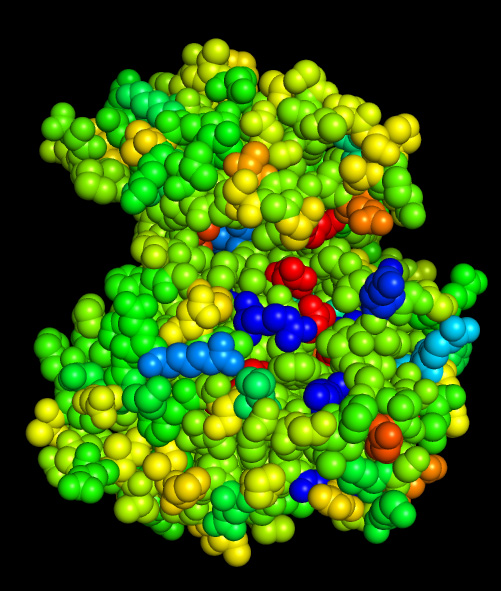
Charge conservation
Composite coloring schemes.
Finally, it is possible to construct transformed scores by, for example, subtracting the covariation scores from the conservation scores. Produced scores should be in the [0, 1] range when doing such manipulations. Negative scores produced by substractions are OK as they will be treated as "0" during the PDB B-factor writing step.
To construct the above composite score, first calculate conservation scores:
Copy these values to Excel, then, calculate co-variation scores and copy them to Excel as well. If done correctly, both score columns will be of the same length. Now the scores can be subtracted using Excel column transform and the result directly pasted back to the conservation window. The number of values should remain unchanged during any edits.
To accept these pasted (e.g. manually provided) values, use this button:
Now, the composite scores will be written to the PDB file drag-dropped onto the panel.
What would such (conservation)-(physical covariation) scores mean?
The brightest residues will be those that are conserved without making very favorable interactions with the rest of the protein. They could be protein-protein or protein-ligand interface residues or active site residues that are missing their partners in the present PDB structure or have partners not included in the analysis.
Given the variety of the avaialble scroing algorithms, the possibilities for creating composite scores are very extensive.